Charts
Create charts, graphs and info graphics with ruby as SVG, JPG or PNG images
Usage
You can use the command line tool, get help with:
$ bin/charts --help
Create images:
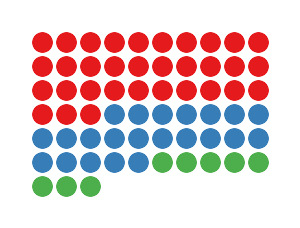
$ bin/charts --data 33,22,8 --filename images/dots.jpg
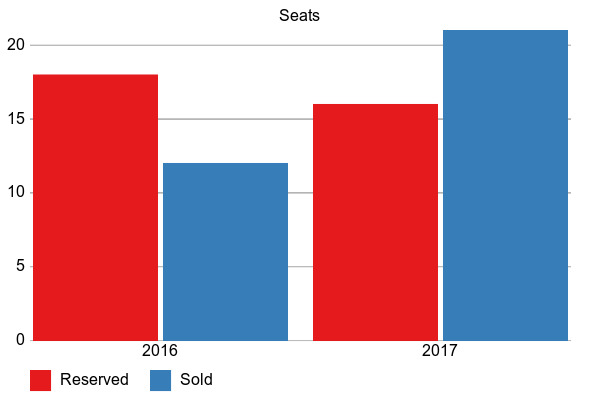
$ bin/charts --data 18,16 --data 12,21 --style bar --title Seats --labels Reserved,Sold --group-labels 2016,2017 --filename images/bars.jpg
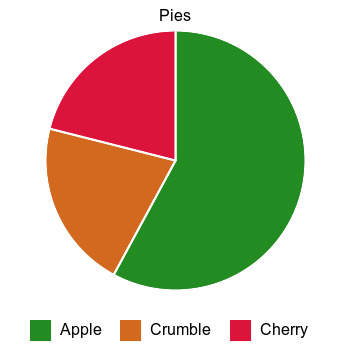
$ bin/charts --data 55,20,20 --style pie --title Pies --labels Apple,Crumble,Cherry --colors ForestGreen,Chocolate,Crimson --width 350 --height 350 --filename images/pie.jpg
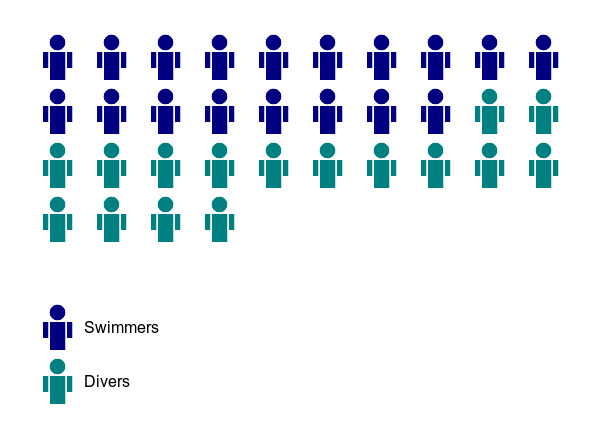
$ bin/charts --data 18,16 --labels Swimmers,Divers --colors Navy,Teal --style manikin --item-width 50 --item-height 50 --filename images/manikin.jpg
See https://en.wikipedia.org/wiki/Web_colors#X11_color_names to find more color names you can use.
Create text:
$ bin/charts --columns 20 --data 55,33,22 --colors x,o,* -t txt

xxxxxxxxxxxxxxxxxxxx
xxxxxxxxxxxxxxxxxxxx
xxxxxxxxxxxxxxxooooo
oooooooooooooooooooo
oooooooo************
**********
Development
Start by installing bundler:
gem install bundler
And then install the dependencies:
bundle install
Run the test suite:
rake
or
rspec