Droid::Monitor
Monitoring Android cpu or memory usage and create their simple graph with Google API.
Read also: https://developer.android.com/training/testing/performance
Installation
Add this line to your application's Gemfile:
gem 'droid-monitor'And then execute:
$ bundle
Or install it yourself as:
$ gem install droid-monitor
Quick Start with Sample
See under sample file in this repository.
The sample use clockwork to run ruby script in particular terms.
$ cd sample
$ bundle install
$ bundle exec clockwork example_cpu.rb
Usage
Followings are only storing data. They don't include cron like clockwork.
CPU
with cpuinfo
require "droid/monitor/cpu"

# initialize
@cpu = Droid::Monitor::Cpu.new( { package: "com.android.chrome" } )

# save data into @cpu.cpu_usage
@cpu.store_dumped_cpu_usage

# export data into filename as google api format
filename = "sample_data.txt"
@cpu.save_cpu_usage_as_google_api(filename)

# export data into filename which is used the above command.
output_file_path = "sample.html"
graph_opts = { title: "Example", header1: "this graph is just sample"}
@cpu.create_graph(filename, graph_opts, output_file_path)

#clear @cpu.cpu_usage
@cpu.clear_cpu_usage
with top command
require "droid/monitor/cpu"

# initialize
@cpu = Droid::Monitor::Cpu.new( { package: "com.android.chrome" } )

# save data into @cpu.cpu_usage
@cpu.store_dumped_cpu_usage_with_top

# export data into filename as google api format
filename = "sample_data.txt"
@cpu.save_cpu_usage_as_google_api_with_top(filename)

# export data into filename which is used the above command.
output_file_path = "sample.html"
graph_opts = { title: "Example", header1: "this graph is just sample"}
@cpu.create_graph(filename, graph_opts, output_file_path)

#clear @cpu.cpu_usage
@cpu.clear_cpu_usage
Graph

Memory
require "droid/monitor/memory"

# initialize
# You can specify target devices with providing device serial which is provided via adb devices.
@memory = Droid::Monitor::Memory.new( { package: "com.android.chrome", device_serial: "device_serials"} )

# save data into @memory.memory_usage
@memory.store_dumped_memory_details_usage

# export data into filename as google api format
filename = "sample_data.txt"
@memory.save_memory_details_as_google_api(filename)

# export data into filename which is used the above command.
output_file_path = "sample.html"
graph_opts = { title: "Example", header1: "this graph is just sample"}
@memory.create_graph(filename, graph_opts, output_file_path)

#clear @memory.memory_detail_usage
@memory.clear_memory_usage
Graph

Net
Android 5.x can't get netstats.
require "droid/monitor/net"

# initialize
@net = Droid::Monitor::Net.new( { package: "com.android.chrome" } )

@data_file = "sample.txt"
@data_file2 = "sample2.txt"

# save data into @net.tcp_rec, @net.tcp_snd
@net.store_dumped_tcp_rec
@net.store_dumped_tcp_snd

# export data into filename as google api format
finename1 = "sample_data1.txt"
finename2 = "sample_data2.txt"
@net.save_cpu_usage_as_google_api_rec(finename1)
@net.save_cpu_usage_as_google_api_snd(finename2)

# export data into filename which is used the above command.
output_file_path1 = "sample1.html"
output_file_path2 = "sample2.html"
graph_opts = { title: "Example", header1: "this graph is just sample"}
@net.create_graph(@data_file, graph_opts, output_file_path1)
@net.create_graph(@data_file2, graph_opts, output_file_path2)

# clear @net.tcp_rec and @net.tcp_snd
@net.clear_tcps
or
@net.clear_tcps_rec
@net.clear_tcps_snd
Graph
- receive tcp

- send tcp

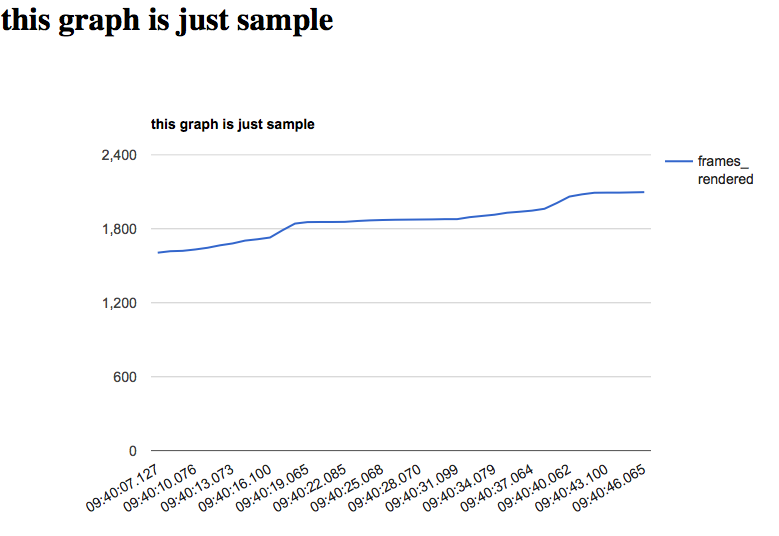
Gfxinfo
require "droid/monitor/gxfinfo"

# initialize
@gfx = Droid::Monitor::Gfxinfo.new( { package: "com.android.chrome" } )

# save data into @gfx.gfxinfo_usage
@gfx.store_dumped_gfxinfo_usage

# export data into filename as google api format
data_file_gfx = "sample_gfx.txt"
data_file_mem = "sample_mem.txt"
data_file_frame = "sample_frame.txt" # Can't get frame rendered if api level of target devices are 21 or 22.(Android 5.x)
@gfx.save_gfxinfo_usage_as_google_api(data_file_gfx, data_file_mem, data_file_frame)

# export data into filename which is used the above command.
output_file_path1 = "sample1.html"
output_file_path2 = "sample2.html"
output_file_path3 = "sample3.html"

graph_opts = { title: "Example", header1: "this graph is just sample"}
@gfx.create_graph(@data_file_gfx, graph_opts, output_file_path1)
@gfx.create_graph(@data_file_mem, graph_opts, output_file_path3)
@gfx.create_graph(@data_file_frame, graph_opts, output_file_path3)

# clear @net.tcp_rec and @net.tcp_snd
@gfx.clear_gfxinfo_usage
Graph
- gfx
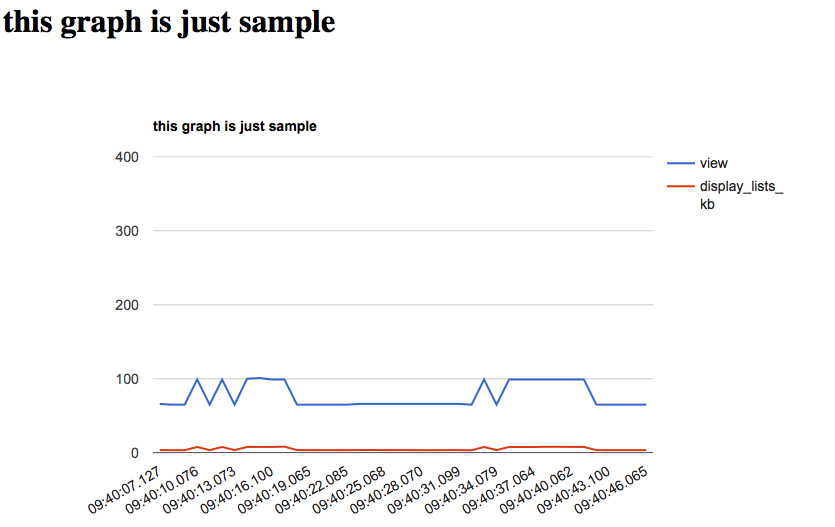
- memory
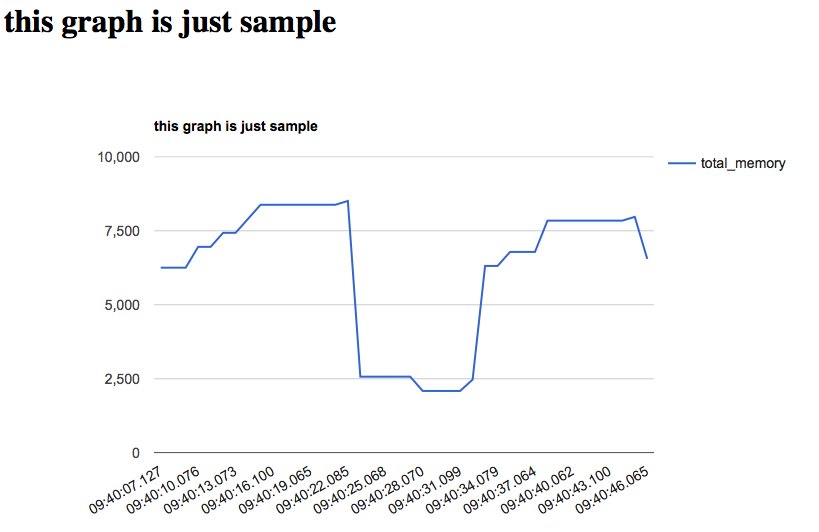
- frame
Can't get frame rendered if api level of target devices are 21 or 22.(Android 5.x)
Notice
- Some browser, like Google Chrome, can't see local file via page. So, you should see report html file via FireFox as example.
Battery
For battery
Reference
License
MIT license. Please see here.
Contributing
- Fork it ( https://github.com/[my-github-username]/droid-monitor/fork )
- Create your feature branch (
git checkout -b my-new-feature) - Commit your changes (
git commit -am 'Add some feature') - Push to the branch (
git push origin my-new-feature) - Create a new Pull Request