Karafka Web
![]()

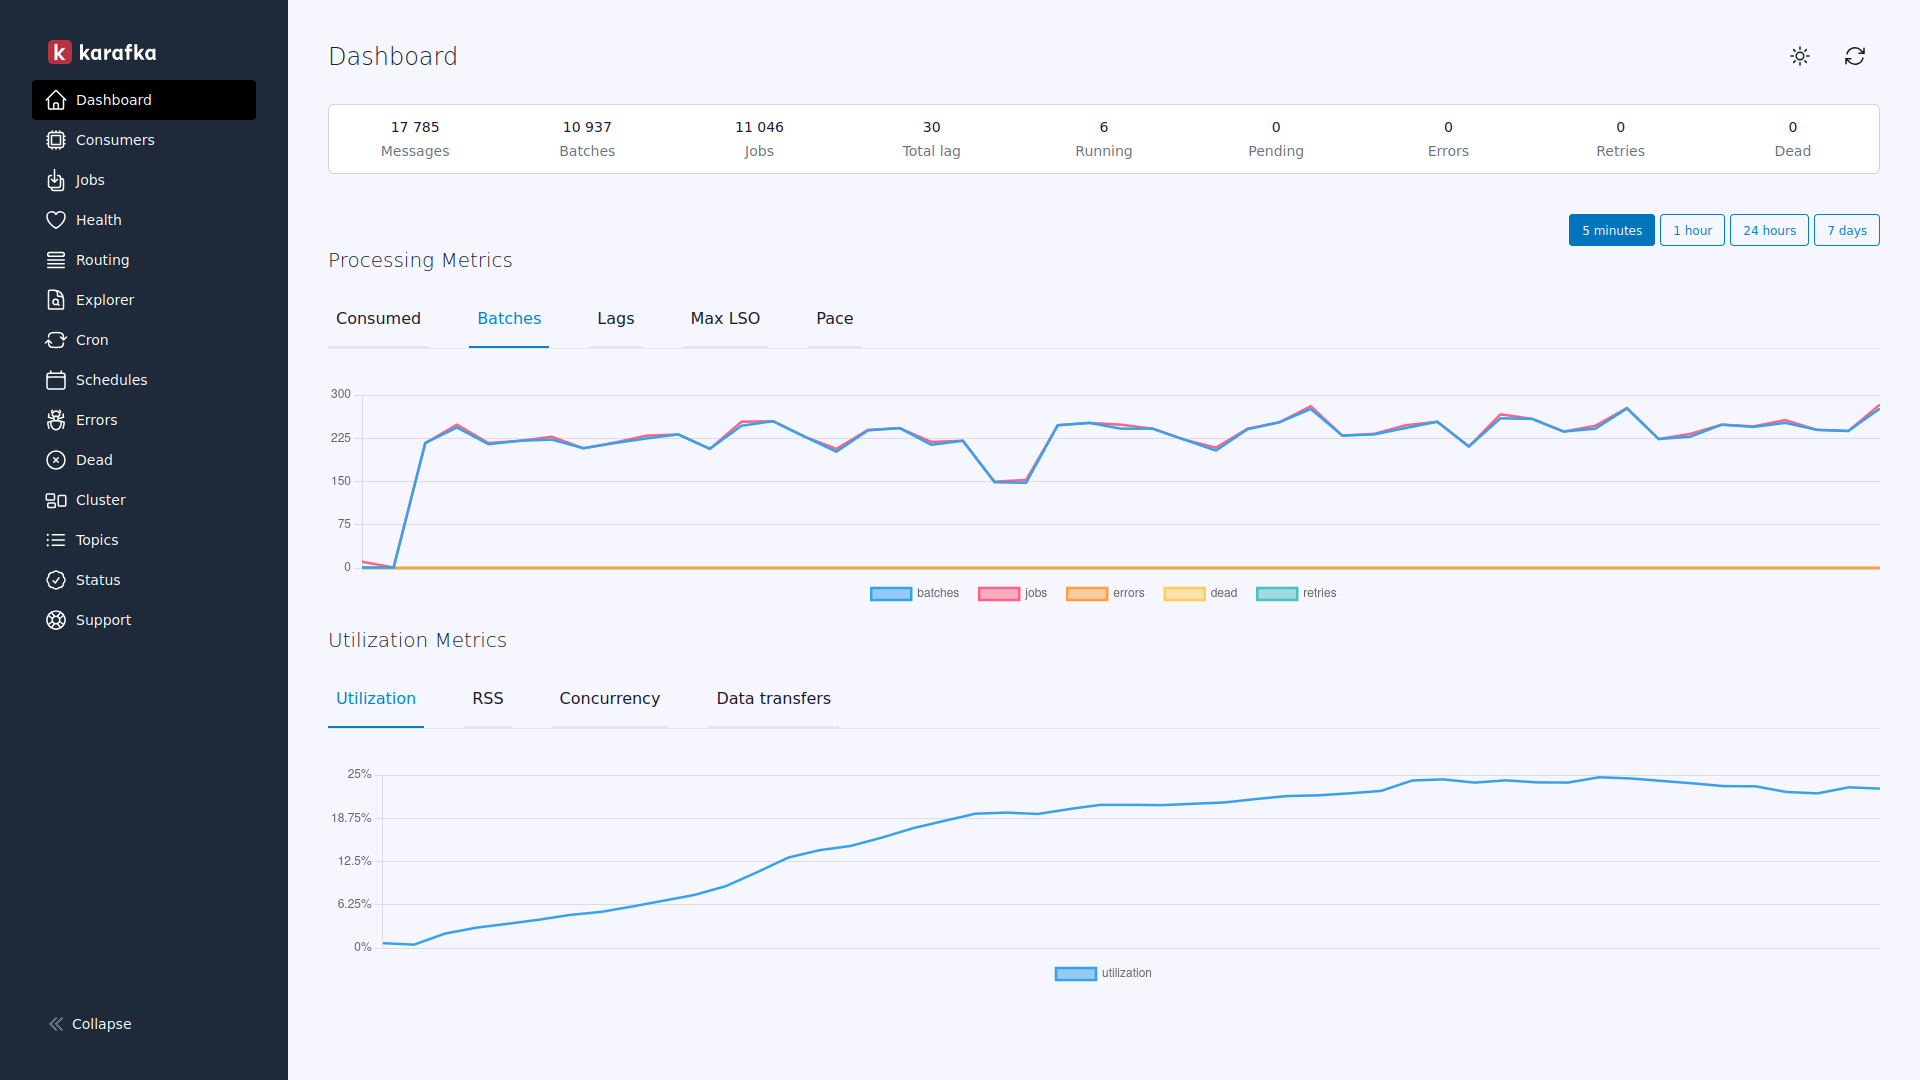
Karafka Web UI is a web-based interface for the Karafka framework. The Web UI provides a convenient way for developers to monitor and manage their Kafka-based applications, eliminating the need to use command-line tools or third-party software.
It provides easy access to various metrics, including the number of messages consumed, the number of errors, and the number of consumers in operation. It also provides a way to view the various Kafka topics, consumers, and groups used by the application.
Important
Documentation for all ecosystem components, including the Web UI, is available in the Karafka framework docs Wiki.
Getting started
To get started with the Karafka Web UI, see the Web UI chapter of the Karafka documentation Wiki.
Karafka Pro Enhanced Web UI
The Enhanced Web UI, in addition to all the features from the OSS version, also offers additional features and capabilities not available in the free version, making it a more robust option for those seeking enhanced monitoring and management capabilities for their Karafka applications. Some of the key benefits of the Enhanced Web UI version include the following:
- Real-time and historical processing and utilization metrics
- Real-time topics lag awareness
- Enhanced consumer utilization metrics providing much better insights into process and resource utilization
- Consumer process inspection to quickly analyze the state of a given consuming process
- Consumer jobs inspection to view currently running jobs on a per-process basis
- A health dashboard containing general consumption overview information
- Data Explorer allowing for viewing and exploring the data produced to Kafka topics and understanding the routing table and deserializing data before it is displayed
- Enhanced error reporting allowing for backtrace inspection and providing multi-partition support
- DLQ / Dead insights allowing navigation through DLQ topics and messages dispatched
Help me provide high-quality open-source software. For more details, see the Karafka homepage.