Principal Component Analysis (PCA)
Principal component analysis in Ruby. Uses GSL for calculations.
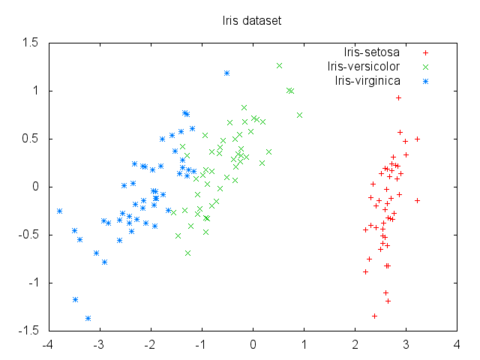
PCA can be used to map data to a lower dimensional space while minimizing information loss. It's useful for data visualization, where you're limited to 2-D and 3-D plots.
For example, here's a plot of the 4-D iris flower dataset mapped to 2-D via PCA:
PCA is also used to compress the features of a dataset before feeding it into a machine learning algorithm, potentially speeding up training time with a minimal loss of data detail.
Install
GSL must be installed first. On OS X it can be installed via homebrew: brew install gsl
gem install pca
Example Usage
require 'pca'

pca = PCA.new components: 1

data_2d = [
  [2.5, 2.4], [0.5, 0.7], [2.2, 2.9], [1.9, 2.2], [3.1, 3.0],
  [2.3, 2.7], [2.0, 1.6], [1.0, 1.1], [1.5, 1.6], [1.1, 0.9]
]

data_1d = pca.fit_transform data_2d

# Transforms 2d data into 1d:
# data_1d ~= [
#   [-0.8], [1.8], [-1.0], [-0.3], [-1.7],
#   [-0.9], [0.1], [1.1], [0.4], [1.2]
# ]

more_data_1d = pca.transform [ [3.1, 2.9] ]

# Transforms new data into previously fitted 1d space:
# more_data_1d ~= [ [-1.6] ]

reconstructed_2d = pca.inverse_transform data_1d

# Reconstructs original data (approximate, b/c data compression):
# reconstructed_2d ~= [
#   [2.4, 2.5], [0.6, 0.6], [2.5, 2.6], [2.0, 2.1], [2.9, 3.1]
#   [2.4, 2.6], [1.7, 1.8], [1.0, 1.1], [1.5, 1.6], [1.0, 1.0]
# ]

evr = pca.explained_variance_ratio

# Proportion of data variance explained by each component
# Here, the first component explains 99.85% of the data variance:
# evr ~= [0.99854]
See examples for more. Also, peruse the source code (~ 100 loc.)
Options
The following options can be passed in to PCA.new:
| option | default | description |
|---|---|---|
| :components | nil | number of components to extract. If nil, will just rotate data onto first principal component |
| :scale_data | false | scales features before running PCA by dividing each feature by its standard deviation. |
Working with Returned GSL::Matrix
PCA#transform, #fit_transform, #inverse_transform and #components return instances of GSL::Matrix.
Some useful methods to work with these are the #each_row and #each_col iterators,
and the #row(i) and #col(i) accessors.
Or if you'd prefer to work with a standard Ruby Array, you can just call #to_a and get an array of row arrays.
See GSL::Matrix RDoc for more.
Plotting Results With GNUPlot
Requires GNUPlot and gnuplot gem.
require 'pca'
require 'gnuplot'

pca = PCA.new components: 2
data_2d = pca.fit_transform data

Gnuplot.open do |gp|
  Gnuplot::Plot.new(gp) do |plot|
    plot.title "Transformed Data"
    plot.terminal "png"
    plot.output "out.png"

    # Use #col accessor to get separate x and y arrays
    # #col returns a GSL::Vector, so be sure to call #to_a before passing to DataSet
    xy = [data_2d.col(0).to_a, data_2d.col(1).to_a]

    plot.data << Gnuplot::DataSet.new(xy) do |ds|
      ds.title = "Points"
    end
  end
end
Sources and Inspirations
- A tutorial on Principal Components Analysis (PDF) a great introduction to PCA
- Principal Component Analyisis Explained Visually
- scikit-learn PCA
- Lecture video and notes (requires Coursera login) from Andrew Ng's Machine Learning Coursera class
- Implementing a Principal Component Analysis (PCA) in Python step by step
- Dimensionality Reduction: Principal Component Analysis in-depth