rails-data-explorer
rails-data-explorer (RDE) is a Rails engine plugin that makes it magically easy to explore your app's data using charts and statistics.
The purpose of RDE is to help you develop an intuition for your app's data so that you can find patterns, correlations and anomalies in the data that you can then further investigate and exploit.
Examples
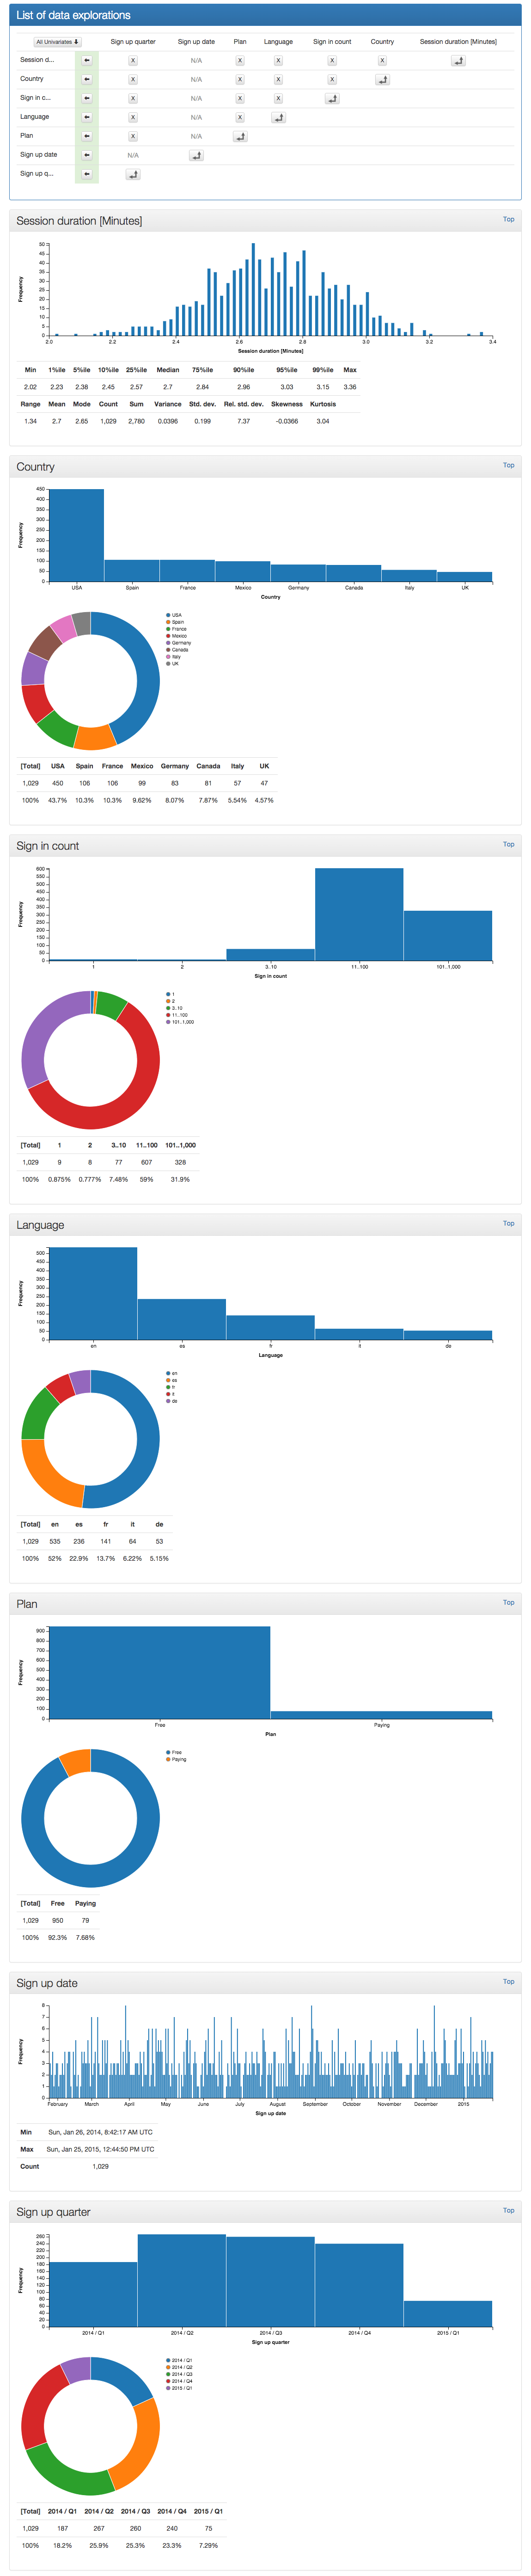
The default charts rendered by rails-data-explorer: Univariate charts and
statistics for every column in your data.
|
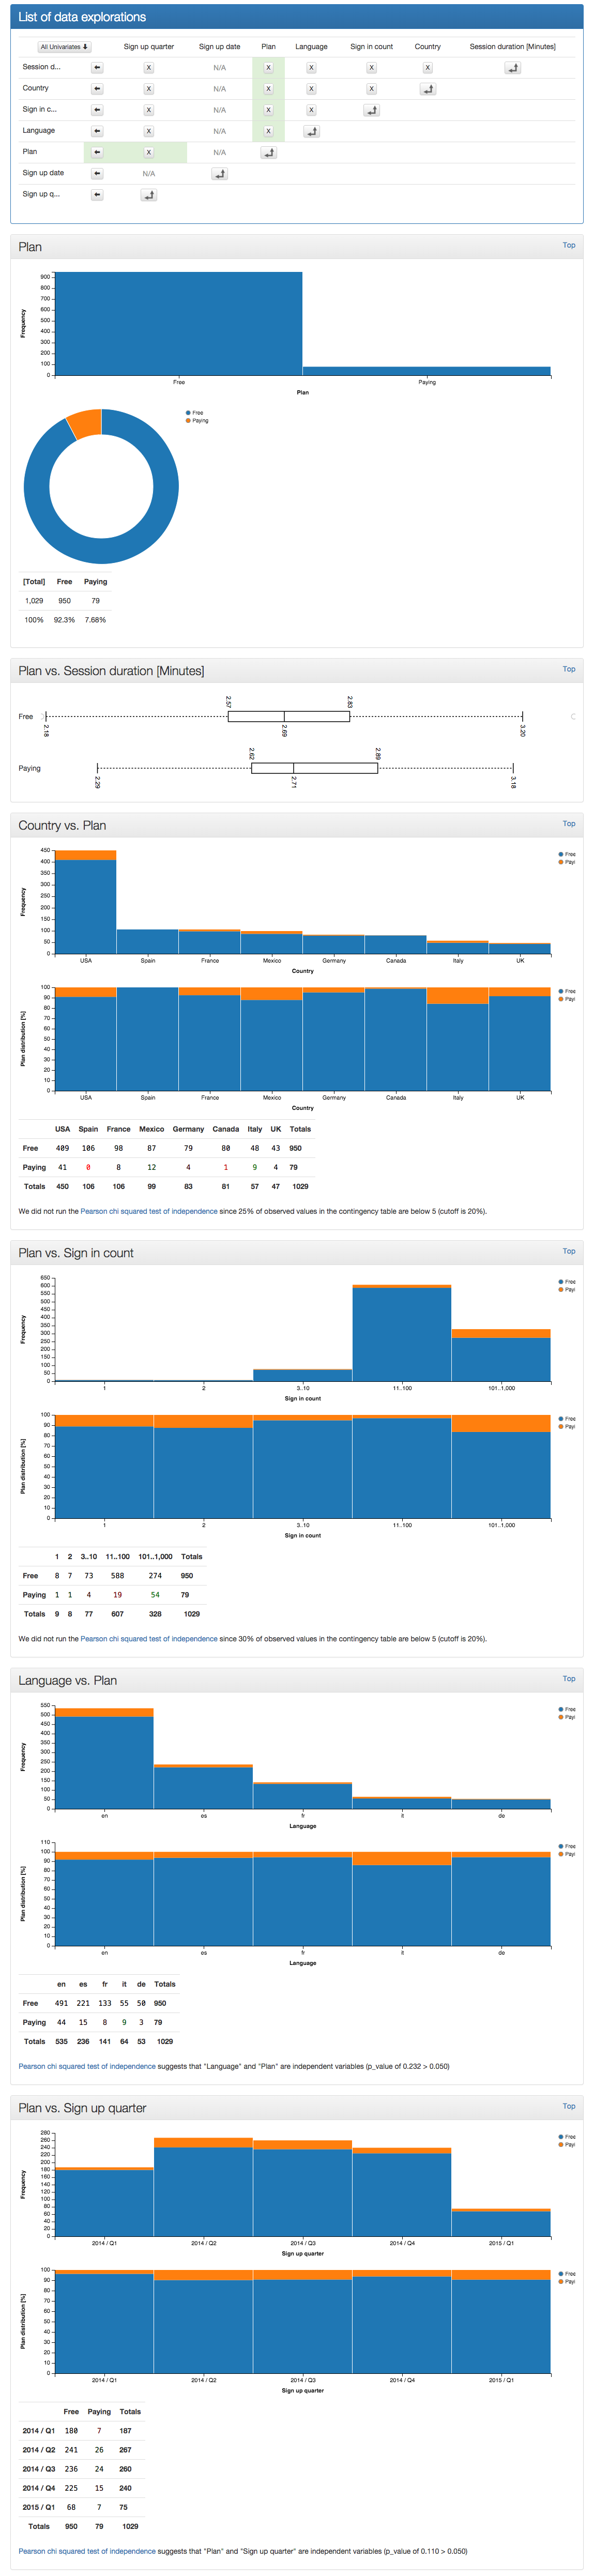
All bivariate charts and statistics for the "Plan" column.
|
Features
- Optimized for simplicity and convenience: All you have to do is provide your data in tabular form. RDE then decides how to best visualize and present your data.
- Batteries included: RDE includes everything required to render stunning charts and visualizations. It is tightly integrated with Rails and doesn't require knowledge of charting libraries, statistics, or data engineering.
- Comprehensive data visualization and analysis: Out of the box RDE gives you univariate charts and statistics for each column of your data. It also gives you single click access to all bivariate combinations of your data columns. With a single config param, it will even generate arbitrary multivariate charts for you.
- Works with small- and medium-sized data: RDE works great for up to ~100K records. I'm thinking about ways to make it work for larger data series using sampling. If you know how to do this correctly in ActiveRecord, please let me know.
Detailed features
- Integrates with ActiveRecord.
- Renders beautiful charts (using Vega/Nvd3 and d3.js).
- Uses best charting practices (using Vega visualization grammar).
- Automatically detects and handles categorical and quantitative data types. (integer, decimal, and temporal)
- Automatically renders visualizations and statistics for univariate, bivariate and multivariate analysis.
- Provides single click access to univarate and all possible combinations of bivariate analyses.
- Automatically picks linear vs. logarithmic axes.
- Automatically finds top N values for categorical data to make charts easier to read.
- Automatically sorts axis labels for maximum clarity.
- Performs Pearson's Chi squared test on bivariate analysis of categorical data. This is super useful when analyzing and interpreting A/B test data, or to find correlations in your data.
- Works well with the Filterrific gem for filtering data before it is fed to RDE.
- Provides statistical utility methods, e.g., to bin or quantize your data.
RDE provides the following chart types:
- Bar chart (simple, stacked, percent distribution)
- Pie chart
- Histogram
- Box plot (single and group)
- Scatterplot
- Parallel coordinates
- Parallel set
- Contingency table with pearson's chi squared test (good to interpret A/B test data)
Installation
gem install rails-data-explorer
or with bundler in your Gemfile:
gem 'rails-data-explorer'
Usage
Let's say you want to explore your app's User signup data. Create a route and
action for users#signups:
# app/controllers/users_controller.rb

def signups
  c_binner = RailsDataExplorer::Utils::DataBinner.new(
    '0' => 0,
    '1' => 1,
    '2' => 2,
    '3..10' => 10,
    '11..100' => 100,
    '101..1,000' => 1000,
    '1,001..10,000' => 10000
  )
  @rde = RailsDataExplorer.new(
    User.all.to_a, # DANGER! Make sure not to load too much data into memory!
    [
      {
        name: "Session duration [Minutes]",
        data_method: Proc.new { |row|
          ((row.session_duration_minutes * 100).round)/100.0
        },
      },
      {
        name: "Country",
        data_method: Proc.new { |row| row.country },
      },
      {
        name: "Sign in count",
        data_method: Proc.new { |row| c_binner.bin(row.sign_in_count) },
      },
      {
        name: "Language",
        data_method: Proc.new { |row| row.language },
      },
      {
        name: "Plan",
        data_method: Proc.new { |row| row.plan },
      },
      {
        name: "Sign up date",
        data_method: Proc.new { |row| row.created_at },
      },
      {
        name: "Sign up quarter",
        data_method: Proc.new { |row|
          year = row.created_at.year
          quarter = (row.created_at.month / 3.0).ceil
          "#{ year } / Q#{ quarter }"
        },
      },
    ],
    params[:rde]
  )
end
Then create a view at app/views/users/signups.html.erb:
<div class="rails-data-explorer">
  <h1>User signup data</h1>
  <%= rails_data_explorer(@rde) %>
</div>
With just a few lines of code you get comprehensive statistics and charts for your data (see screenshots above).
Ways to shoot yourself in the foot
-
Loading too many DB rows at once: Remember that you are loading ActiveRecord
objects, and they can use a lot of ram. It's a cartesian product of number of
rows times columns per record. As a rule of thumb, for a medium sized model with
10 columns, you can load up to ~100K rows. Strategies to mitigate memory bloat:
- Use
find_eachto build up a plain old Array with data just from the columns you are interested in. - Use
selectto limit the number of columns to fetch from the database. - Sample your database. I'm currently investigating ways to do this efficiently.
- Use
-
Using expensive operations in the
:data_methodoption for a given data series: Make sure to only use super simple operations like#.to_s,if, and math operations. Avoid the following:- DB queries.
- Recursive methods (e.g.,
deep_symbolize_keys). - Access 3rd party services and APIs.
- Instantiate common objects in each iteration. Instead instantiate them once outside of the loop and refer to a singleton object.
- Drowning in detail: rails-data-explorer makes it easy to generate a large number of charts. Make sure you don't miss the important data in the noise.
Dependencies
- rails >= 3.1
- Asset pipeline (for batteries included, otherwise you'll have to pull in a number of assets manually)
Resources
License
Copyright
Copyright (c) 2014 - 2015 Jo Hund. See (MIT) LICENSE for details.