Rails Watcher
Help you benchmark / analyze / understand your Rails application.
Usage
Add rails_watcher to your Gemfile.
# rails_watcher will slow down your application, suggest only enable on development environment.
gem 'rails_watcher', require: ENV['RAILS_WATCHER'], group: :development
Start your Rails application with RAILS_WATCHER.
$ RAILS_WATCHER=true rails sThen make some requests to your application, if the response time slow than 10 ms (could be configured), Rails Watcher will capture the all details for your request.
By default, Rails Watcher will save captured data to #{Rails.root}/tmp/rails_watcher.
View Result
If you use default configuration of Rails Watcher, you could use rails_watcher_viewer to view result:
$ gem install -N rails_watcher_viewer
$ cd application_folder/tmp/rails_watcher
$ rails_watcher_viewer
View localhost:4567, you could see the list of your requests:
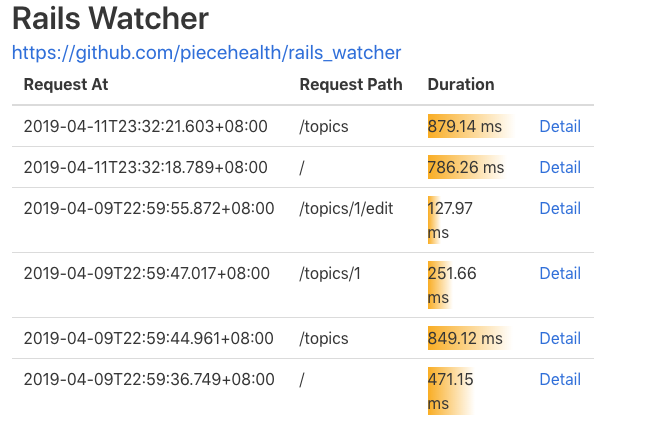 You can navigate to details page, the
 Expensive methods table show the slow methods ordered by net cost:
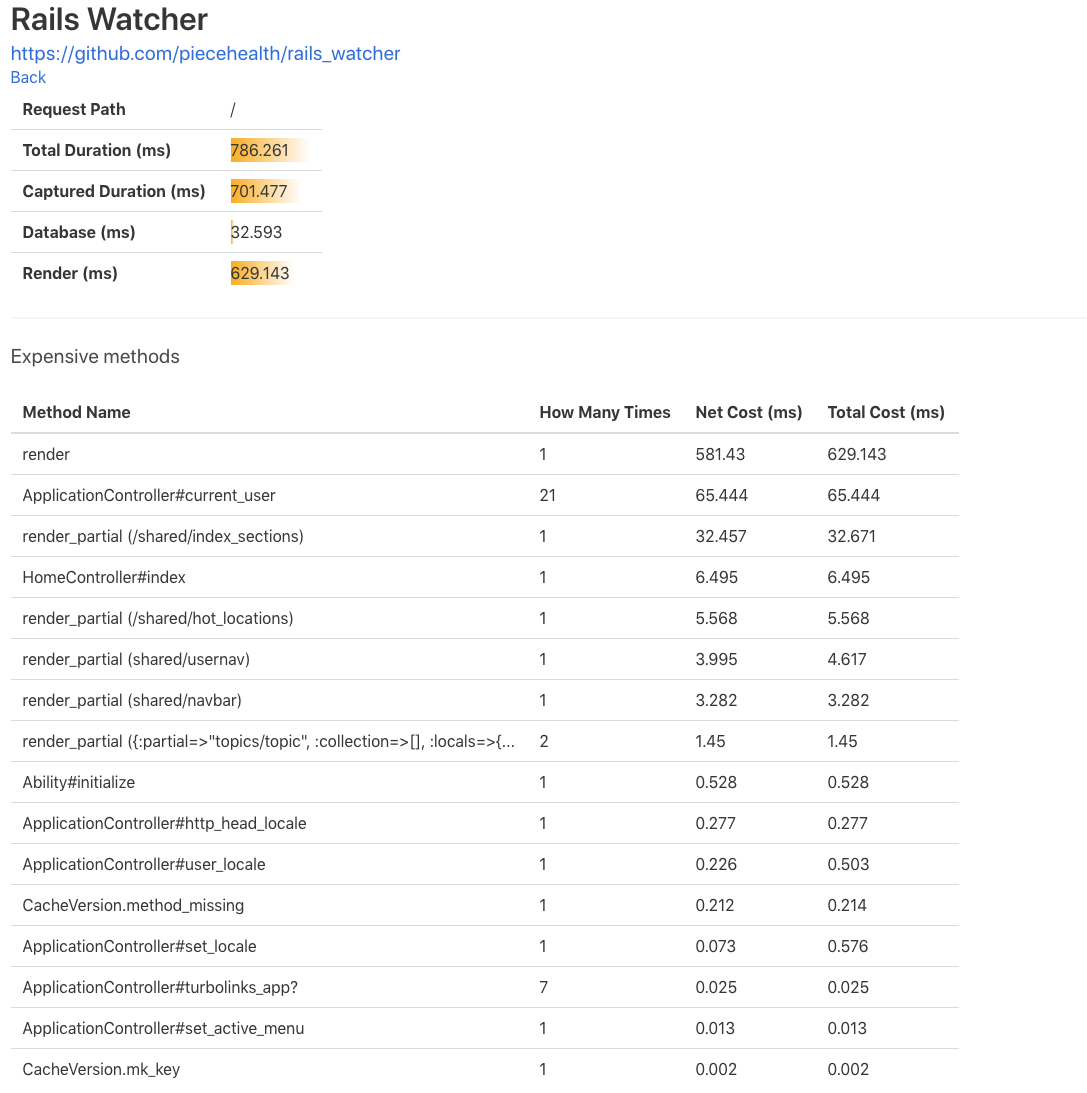
How to calculate net cost
@a = 1
def sample_method
  sleep @a
  inner_method()
  @a += 1
end

def inner_method
  sleep @a * 3
end

sample_method() # will take 1 + 3 = 4 seconds
sample_method() # will take 2 + 6 = 8 seconds
The net cost of sample_method should be 1 + 2 = 3 seconds, the total cost of sample_method should be 4 + 8 = 12 seconds.
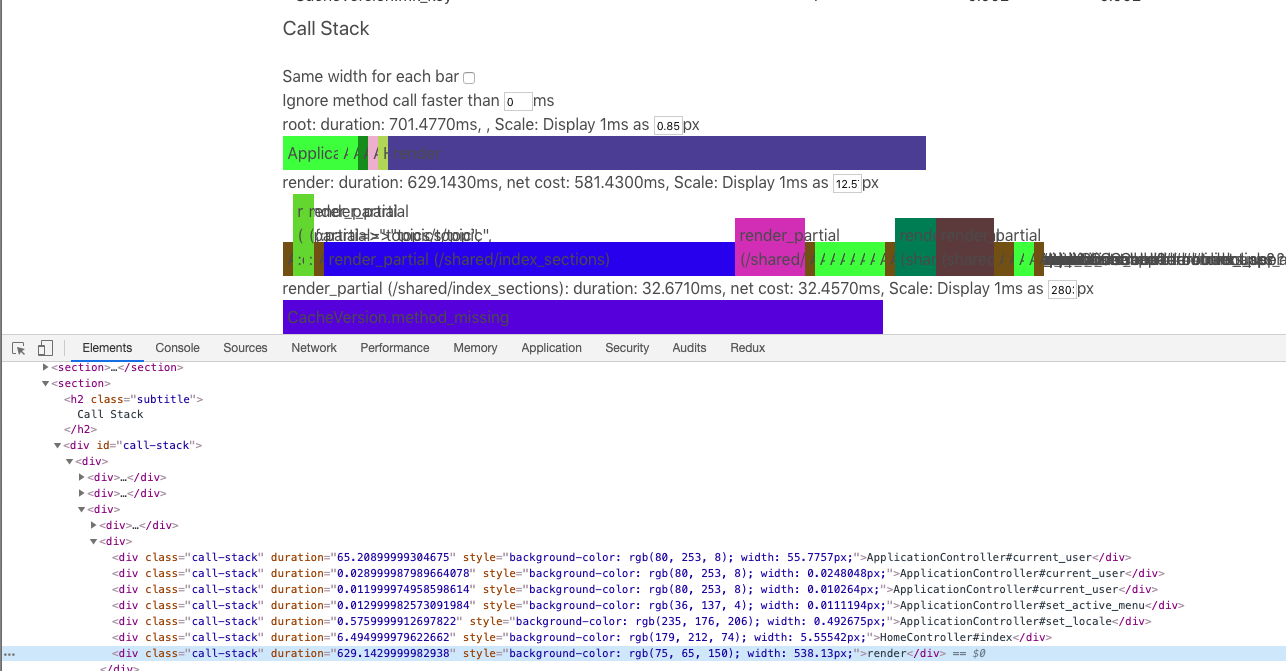 The
The Call Stack section show the call stacks of your application.
Please notice that, it only show the methods inside your application plus any methods you want to watch, which means the Ruby build-in methods and methods inside any gem will not be captured by default. It is great helpful for trouble shooting.
License
The gem is available as open source under the terms of the MIT License.